Updated on May 29, 2026 Responding to Climate Change
- GHG Emissions (Scope 1, 2)
- GHG Emissions (Scope 3)
- TCFD
GHG Emissions (Scope 1, 2)
The GHG Protocol* classifies GHG emissions into three categories: Scopes 1, 2 and 3.
- Scope 1: Direct emissions
GHG emissions generated by fuel combustion at the plants and other facilities of one’s own company
- Scope 2: Indirect emissions
GHG emissions generated by the use of purchased energy such as electricity, heat, and steam supplied by other companies
- Scope 3: Other indirect emissions
GHG emissions along the entire supply chain (from procurement of raw materials to product disposal other than Scope 1 and 2.)
*
GHG Protocol (Greenhouse Gas Protocol) is an initiative to develop international standards and related tools on greenhouse gases and climate change led by the World Resources Institute (WRI) and World Business Council for Sustainable Development (WBCSD) and participated in by corporations, NGOs, government institutions and other organizations throughout the world.
Initiatives and Results
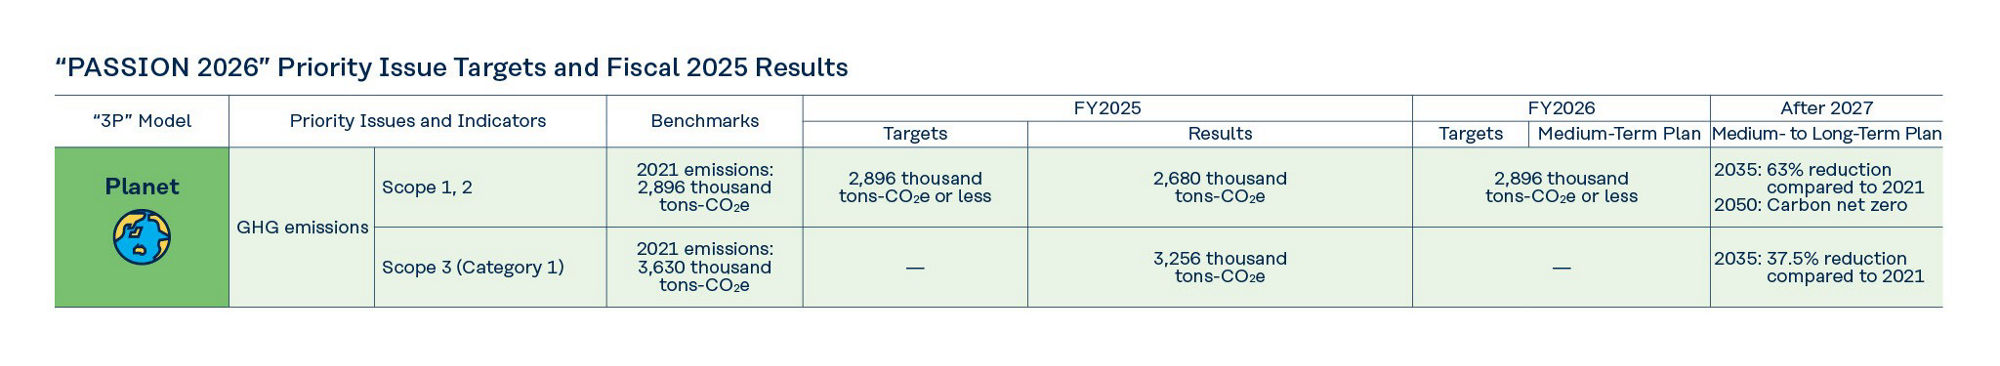
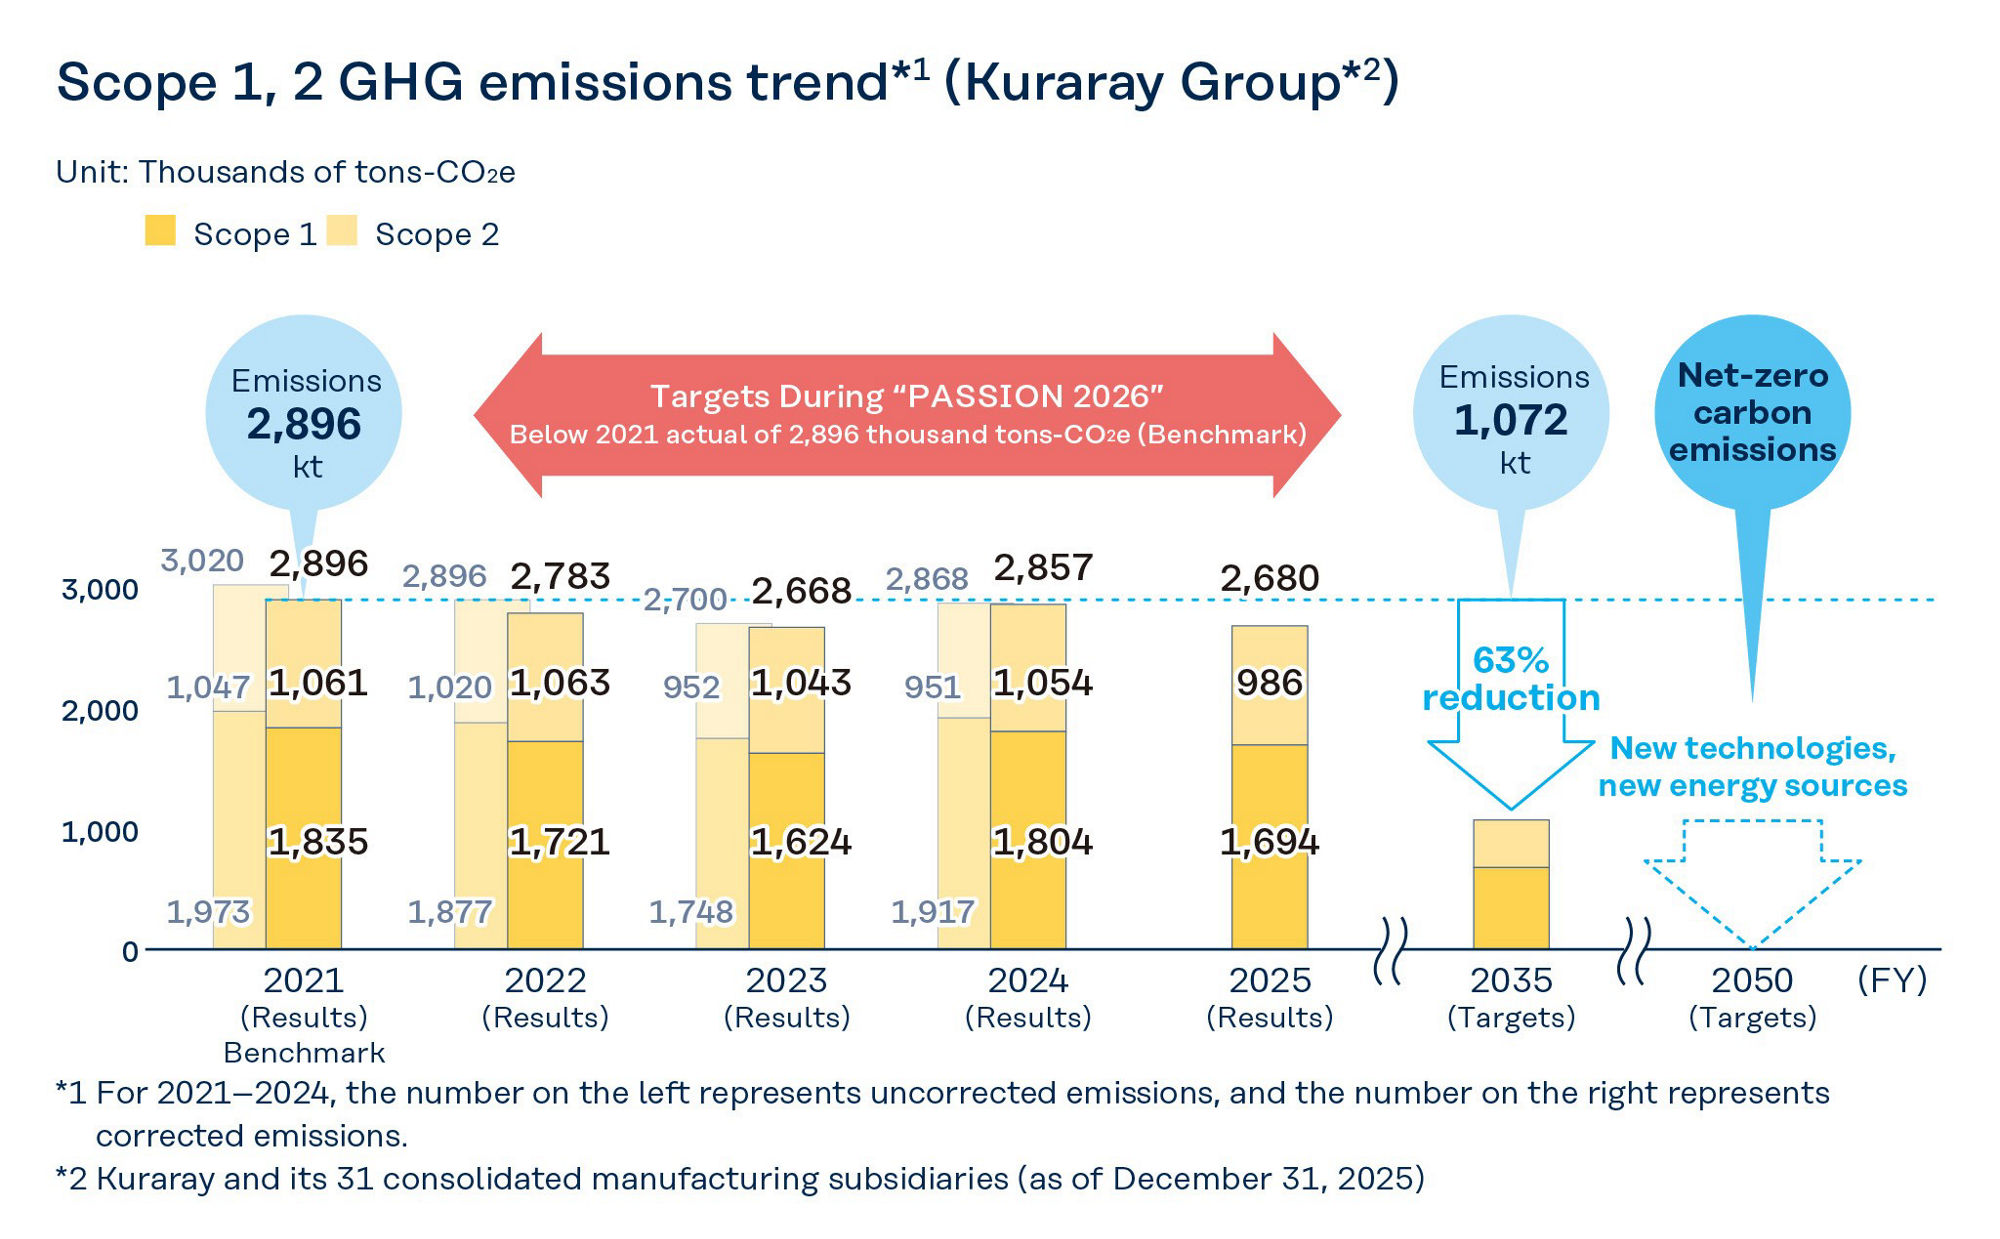
Total GHG emissions (Scope 1, 2) of the Kuraray Group in 2025 decreased by 6.2% from 2,857 thousand tons-CO2e in 2024 to 2,680 thousand tons-CO2e (a 7.5% decrease from 2021 levels).
In Japan, GHG emissions of the Kuraray Group decreased from 1,197 thousand tons-CO2e in 2024 to 1,130 thousand tons-CO2e in 2025. This was due to reduced fossil fuel-derived emissions, resulting from long-term shutdowns of in-house power generation facilities at a production site for repairs and a switch to externally supplied electricity. In addition, continued efforts across production sites―including improving product yields, recycling raw materials and utilities, upgrading to energy-saving equipment, and carrying out energy-saving activities (waste elimination activities)―resulted in a reduction of 22 thousand tons-CO2e.
Outside Japan, GHG emissions of the Kuraray Group decreased from 1,660 thousand tons-CO2e in 2024 to 1,550 thousand tons-CO2e in 2025 (including the effect of acquiring unbundled energy attribute certificates and procuring renewable energy-based utilities equivalent to 106 thousand tons-CO2e, which are included in this GHG emissions reduction). This decrease was achieved despite increased production at new sites in Thailand and Poland, mainly due to reduced energy consumption resulting from production suspensions for inventory adjustments at some sites, as well as continued efforts across production sites to improve energy efficiency and product yields.
The Kuraray Group’s total GHG emissions increased in the period from 2014 to 2019 due to the incorporation of businesses through M&A, such as the acquisition of the vinyl acetate business and the activated carbon business (Calgon Carbon Corporation). In particular, the acquisition of Calgon Carbon Corporation in 2018 resulted in a significant rise in the Kuraray Group’s GHG emissions. The GHGs emitted by Calgon Carbon Corporation consist largely of the CO2 generated as a byproduct in the process of producing activated carbon products. Activated carbon is produced by burning a part of coal used in the process to form micropores on its surface. At this stage of the process, the carbon removed from the surface of the coal to form micropores is released into the atmosphere as CO2. In this way, activated carbon emits a large amount of CO2 during production. On the other hand, activated carbon is widely used around the world as an indispensable product for the adsorption and removal of hazardous chemical substances contained in factory waste gas and for the purification of industrial effluents and raw water for drinking. Activated carbon thus contributes greatly to improving the global environment and reducing environmental impact. The Kuraray Group will continue to consider establishing the technologies to implement Carbon dioxide Capture, Utilization and Storage (CCUS) system applicable to by-product CO2 in the production process. We will also continue to invest in energy-saving, fuel conversion, and the transition to renewable energy for electricity. Furthermore, we are exploring the procurement of carbon-free clean energy sources such as green hydrogen and green ammonia around 2035. We aim to achieve a 63% reduction in GHG emissions compared to 2021 levels by 2035 and to achieve carbon net zero by 2050.
< Regarding the Revision of GHG Emissions >
The Kuraray Group has reviewed its calculation methodology to improve the accuracy of accounting for byproduct CO₂ generated in the new activated carbon manufacturing process at Calgon Carbon Corporation. In addition, in light of feedback received from a third-party organization during the preparation process for obtaining voluntary assurance of GHG emissions, we improved the accuracy of the underlying activity data and emission factors. As a result of these improvements, starting in 2024, the Kuraray Group implemented retroactive revisions back to 2021, which served as the base year for its Group’s GHG emissions reduction targets. The results of the revision and details of the changes are shown in the table below.
Table: Breakdown of Revisions to Scope 1 and 2 Emissions
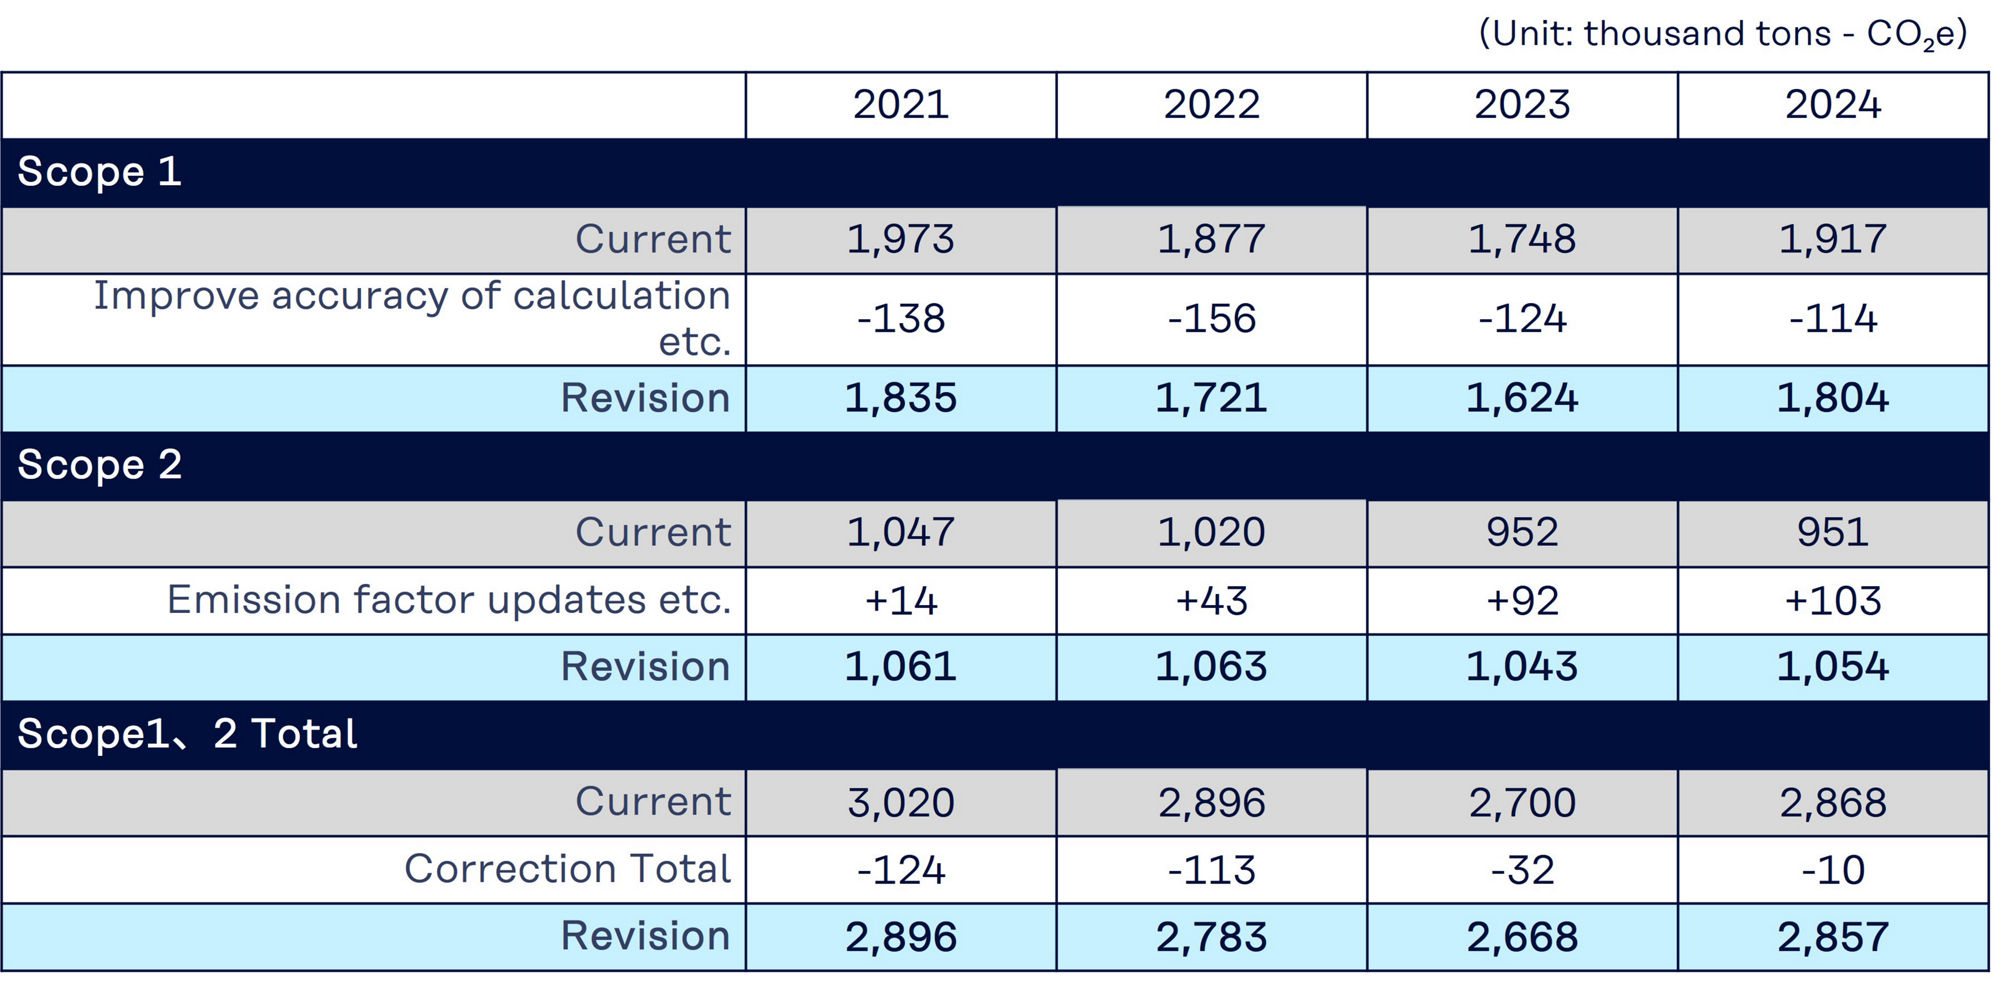
Key Revisions to Scope 1 and Scope 2 Emissions
・Improved accuracy in the calculation of by-product CO2 emissions from the production of activated carbon at Calgon Carbon Corporation (Decrease in Scope 1).
・Updates of the emission factor for purchased steam at production sites in the United States; Revisions of energy unit of purchased steam at production site outside Japan, etc. (Decrease in Scope 2).
<GHG emissions (Scope 1, 2) (Kuraray Group)>
(Unit : Thousand tons-CO2e)
| Kuraray Group | 2021 | 2022 | 2023 | 2024 | 2025 |
|---|---|---|---|---|---|
| GHG emissions (Scope 1, 2) | 2,896 | 2,783 | 2,668 | 2,857 | 2,680 |
| Scope 1 emissions | 1,835 | 1,721 | 1,624 | 1,804 | 1,694 |
| Japan | 1,163 | 1,047 | 970 | 1,031 | 945 |
| Outside Japan | 672 | 674 | 655 | 773 | 749 |
| Scope 2 emissions | 1,061 | 1,063 | 1,043 | 1,054 | 986 |
| Japan | 178 | 189 | 175 | 166 | 185 |
| Outside Japan | 884 | 873 | 868 | 888 | 801 |
*
The GHG emissions shown on this page reflect revisions implemented in March 2026.
For GHG emissions before the revision, please refer here.
*
Due to rounding, totals may not necessarily agree with the sum of the individual figures.
Energy Consumption
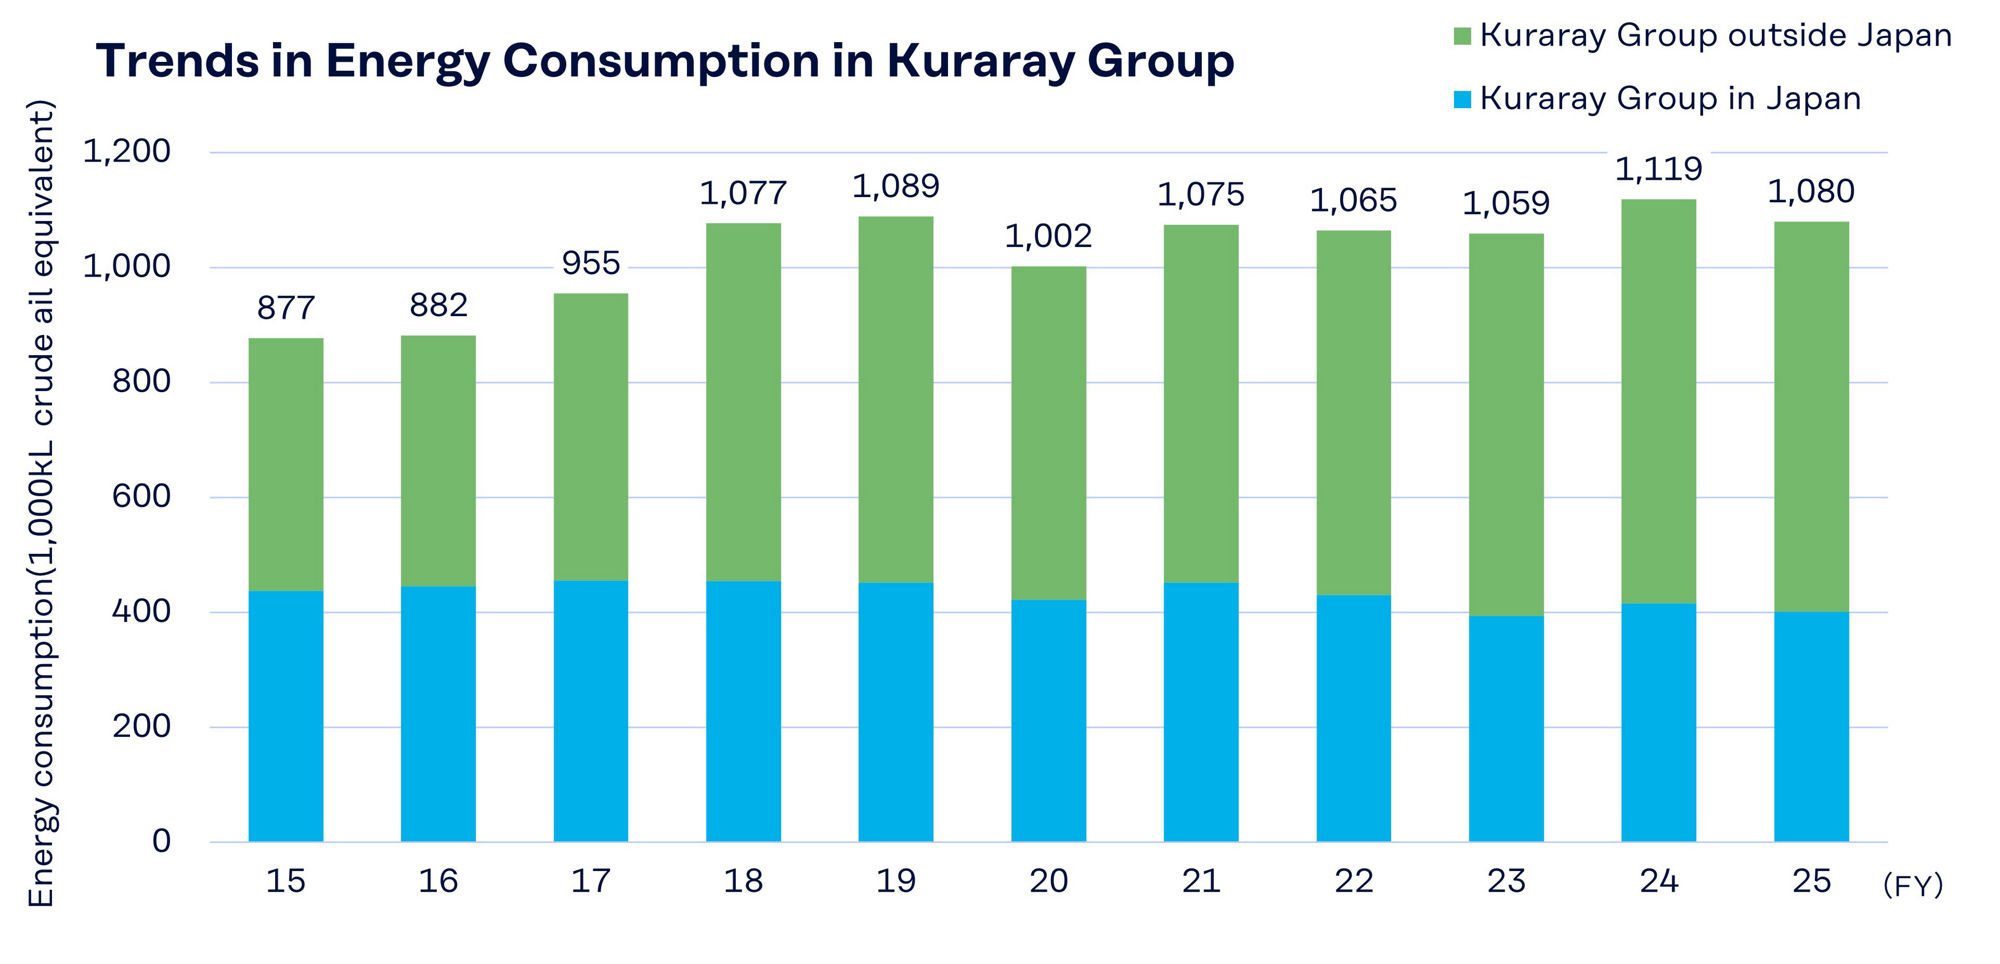
The energy intensity per net sales in the Kuraray Group, which was set as the target in the Sustainability Medium-Term Plan for Planet, reduced by 15.0% (improvement) in 2025 compared to 2019, far exceeding our target of the "Reduction (improvement) of 5% or more in 2026". Going forward, we will continue to improve energy intensity through energy-saving activities that contribute to reducing GHG emissions.
< Energy Consumption (Kuraray Group) >
| Kuraray Group (Japan and outside Japan) | 2019 | 2020 | 2021 | 2022 | 2023 | 2024 | 2025 | |
|---|---|---|---|---|---|---|---|---|
| Energy consumption | crude oil equivalent, 1,000 kl | 1,089 | 1,002 | 1,075 | 1,065 | 1,059 | 1,119 | 1,080 |
| Japan | 452 | 422 | 452 | 430 | 394 | 416 | 402 | |
| Outside Japan | 637 | 580 | 623 | 635 | 665 | 703 | 679 | |
| Sales intensity of energy consumption (intensity of 2019 as 100) | Targets | Reduction of 5% or more in 2026 compared to 2019 | ||||||
| Results | 100 | - | - | - | - | - | 85.0 (15.0% reduction) | |
*
Due to rounding, totals may not necessarily agree with the sum of the individual figures.
GHG Emissions (Scope 3)
Mandated under the Japanese law by which businesses calculate and report Scope 1 and Scope 2 to the government, we report these figures to the government and publish the results mainly in the Kuraray Report and on the Kuraray Group’s website.
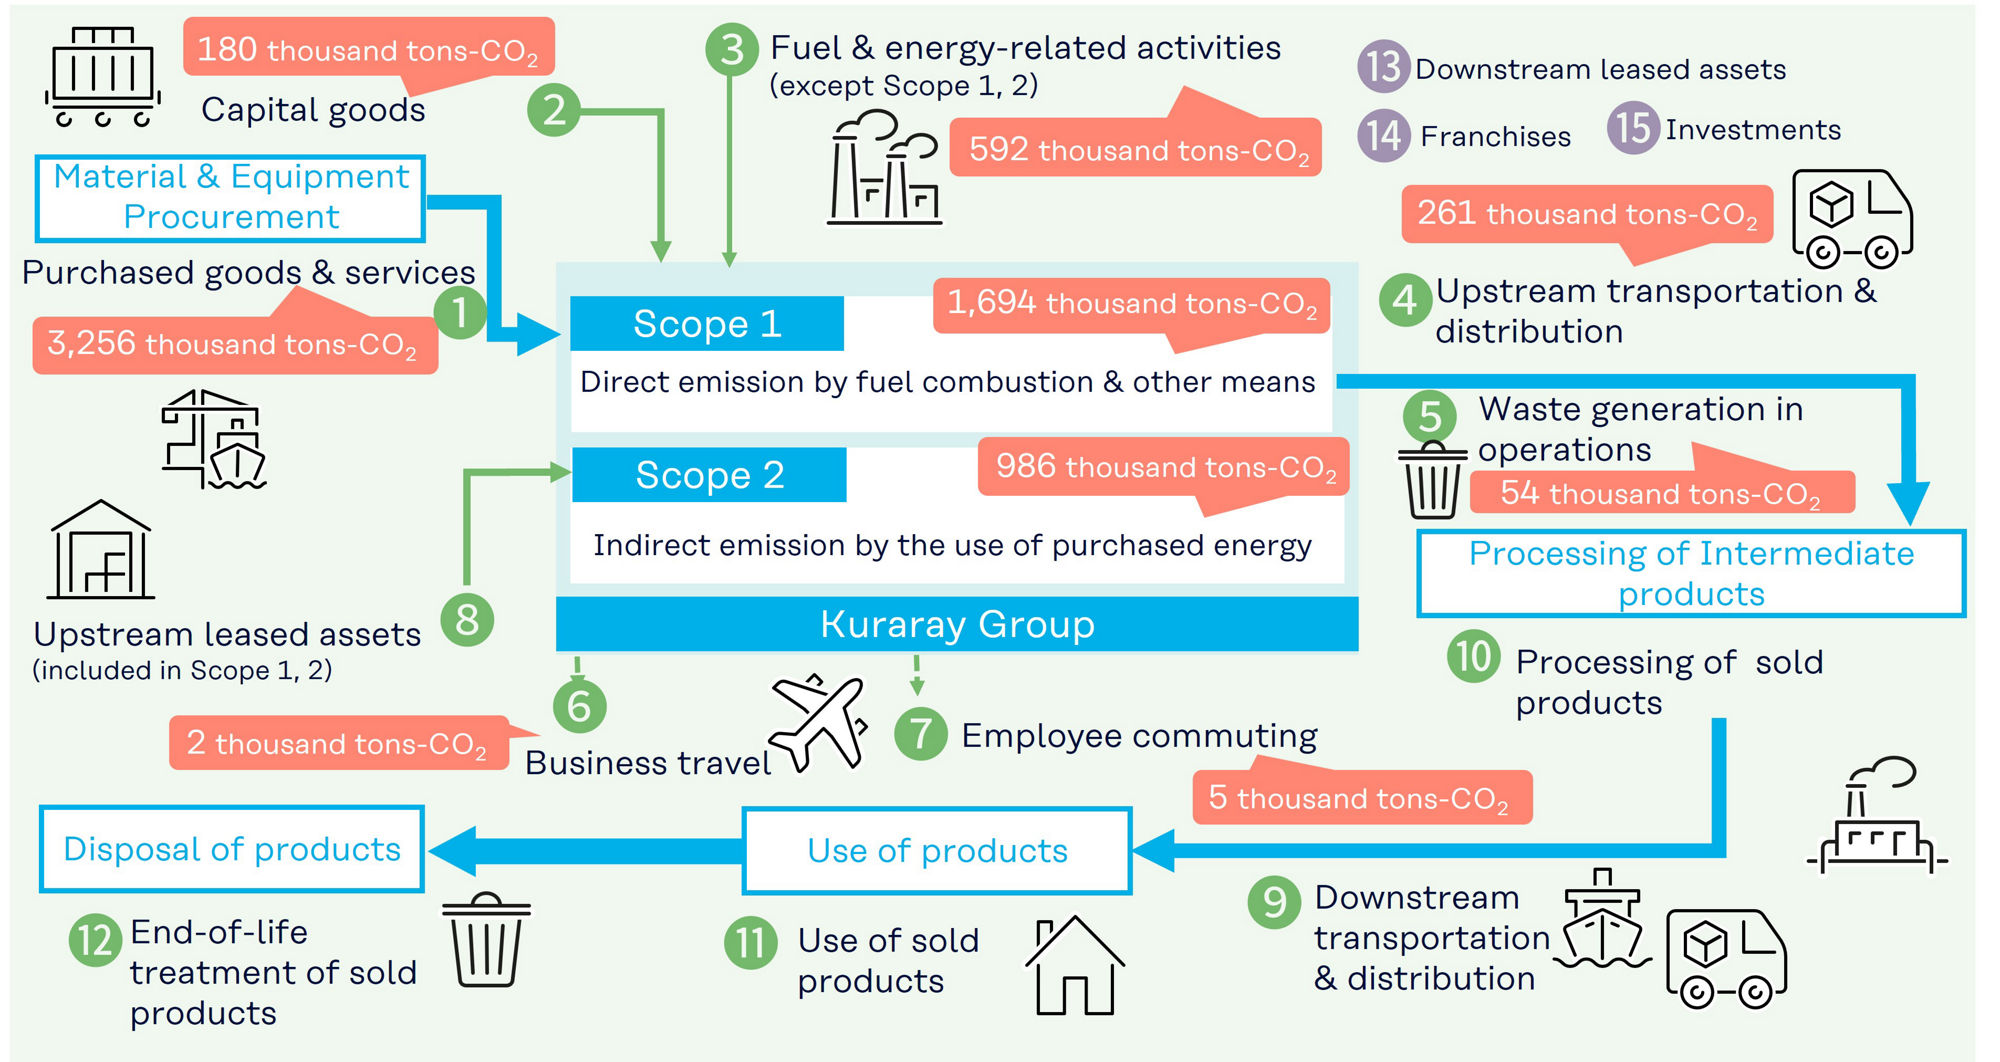
On the other hand, Scope 3, which means the GHG emissions based on the entire supply chain related to us other than Scope 1 and Scope 2, is indirect GHG emissions generated from the viewpoint of a life cycle such as raw material procurement, product distribution, product use and disposal as well as the direct emissions related to our business activities. At the Kuraray Group, we have identified “Purchased goods and services” (Category 1) as the largest source of Scope 3 emissions, and we calculate emissions by applying emissions factors to individual purchased items. As a general rule, we use weight-based emission factors, and only use spend-based factors when weight data is not available, thereby improving calculation accuracy.
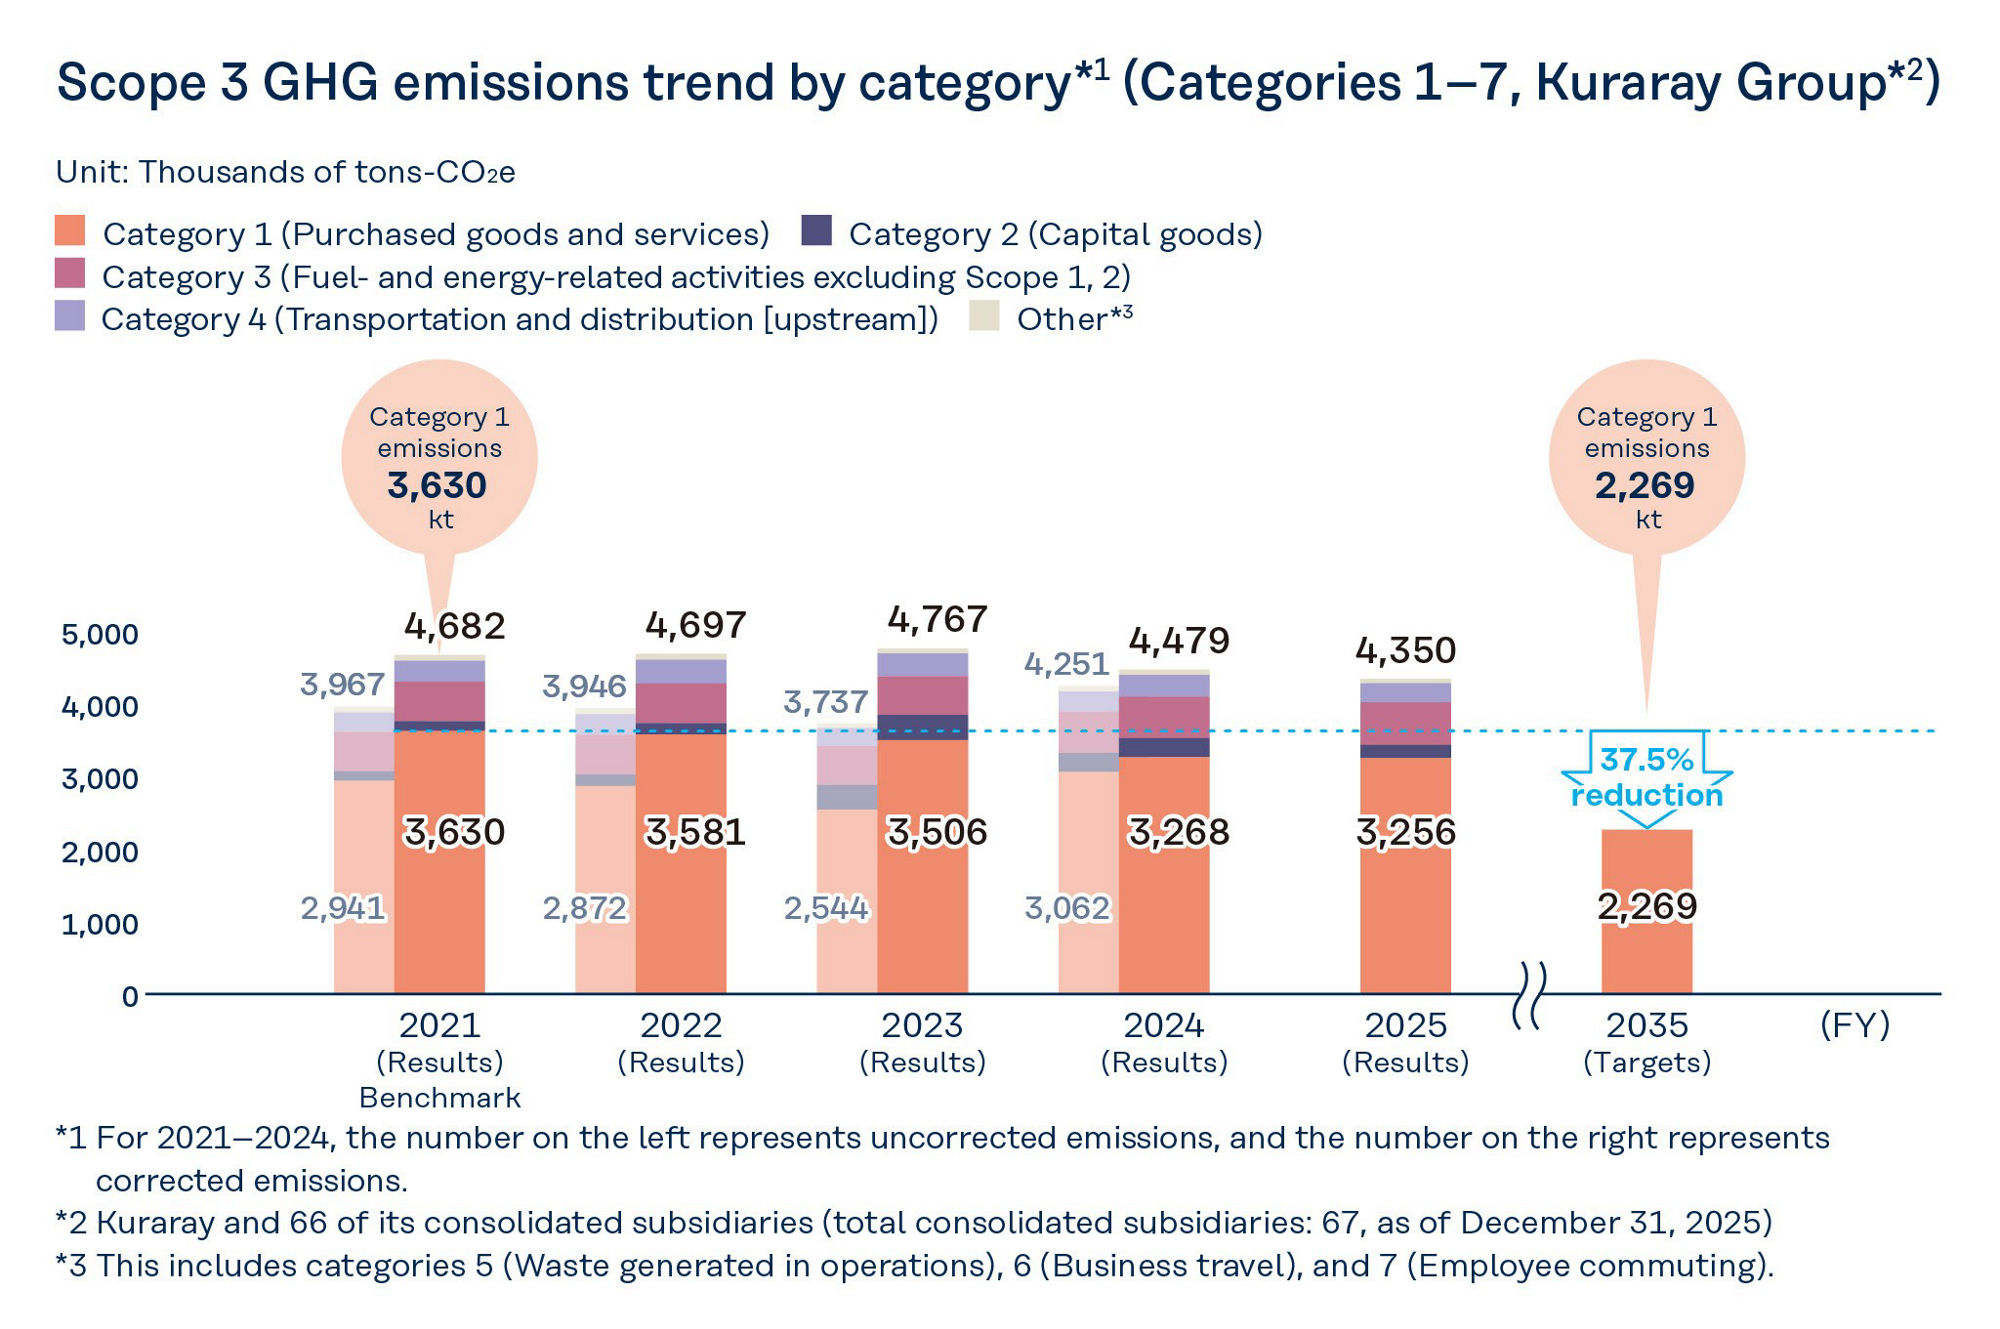
We have set a new goal for Category 1, which accounts for the largest share of GHG emissions within Scope 3, to reduce emissions by 37.5% by 2035 compared with 2021 levels.
Conceptual Image of GHG Emission throughout the Kuraray Group Supply Chain in 2025
( (1) to (15) show categories of Scope 3)
Initiatives and Results
The Kuraray Group's Scope 3 (Category 1) GHG emissions decreased slightly from 3,268 thousand tons-CO2e in 2024 to 3,256 thousand tons-CO2e in 2025 (a 10.3% reduction compared with 2021). We will continue to collaborate with our suppliers to advance efforts to reduce GHG emissions.
< Regarding the Revision of GHG Emissions >
In light of feedback received from a third-party organization during the preparation process for obtaining voluntary assurance of GHG emissions, we improved the accuracy of the underlying activity data and emission factors. We also expanded the scope of calculation. As a result of these improvements, starting in 2024, the Kuraray Group implemented retroactive revisions back to 2021, which served as the base year for its Group’s GHG emissions reduction targets. The results of the revision and details of the changes are shown in the table below.
Table: Breakdown of Revisions to Scope 3 Emissions
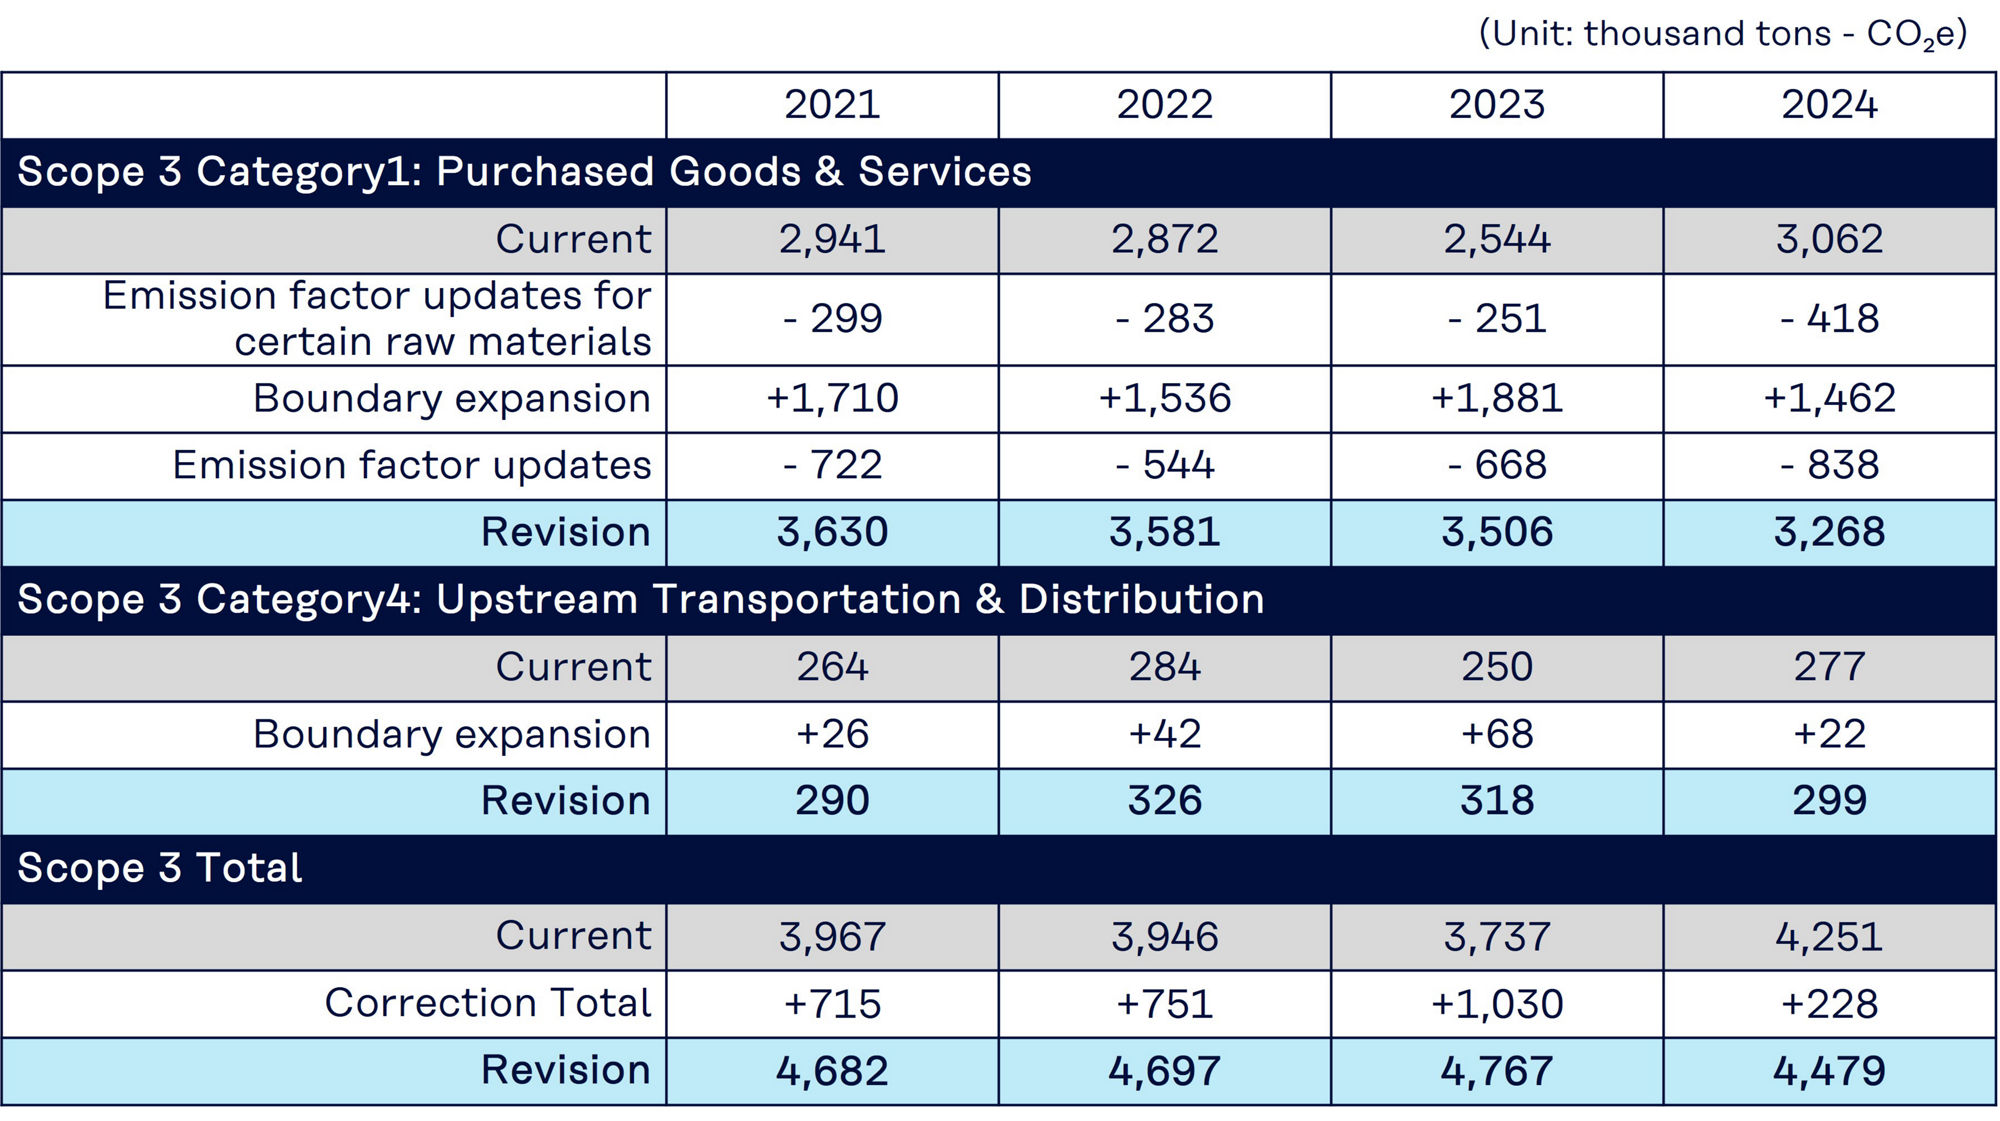
Key Revisions to Scope 3 Emissions (Categories 1 and 4)
・Review of emissions for certain raw materials (Decrease in Category 1)
・Expansion of purchased products and services included in the calculation (Increase in Category 1)
・Revision of emission factors (Decrease in Category 1)
・Revision of Category 4 emissions associated with the expansion of Category 1 calculation boundaries (Increase in Category 4)
<GHG emissions (Scope 3)*1>
(Unit : Thousand tons-CO2e)
| Category | 2021 | 2022 | 2023 | 2024 | 2025 |
|---|---|---|---|---|---|
| 1.Purchased goods and services*2 | 3,630 | 3,581 | 3,506 | 3,268 | 3,256 |
| 2.Capital goods | 133 | 157 | 344 | 263 | 180 |
| 3.Fuel and energy related activities excluding Scope 1, 2 | 546 | 549 | 534 | 574 | 592 |
| 4.Transportation and distribution (upstream) | 290 | 326 | 318 | 299 | 261 |
| 5.Waste generated in operations | 78 | 78 | 58 | 68 | 54 |
| 6.Business travel | 1 | 2 | 2 | 2 | 2 |
| 7.Employee commuting | 4 | 4 | 5 | 5 | 5 |
| 8.Leased assets (upstream) | Emissions from offices, electrical appliances, and company cars are included in Scope 1, 2. | ||||
| 9.Transportation and distribution (downstream) | Kuraray Group's products are mainly sold as intermediate materials for various applications, making it difficult to track and account for emissions from transportation, processing, and end-of-life treatment of sold products. Therefore, it is not feasible to reasonably calculate emissions for these categories, and they are excluded from the calculation. | ||||
| 10.Processing of sold products | |||||
| 11.Use of sold products | |||||
| 12.End-of-life treatment of sold products | |||||
| 13.Leased assets (downstream) | Not applicable because of no leased assets to other company. | ||||
| 14.Franchises | Not applicable as the company does not operate franchise system. | ||||
| 15.Investments | Other company's stock was not held for investment purposes as reported in the Securities Report. | ||||
| Total Scope 3 | 4,682 | 4,697 | 4,767 | 4,479 | 4,350 |
*
The GHG emissions shown on this page reflect revisions implemented in March 2026.
For GHG emissions before the revision, please refer here.
*
Due to rounding, totals may not necessarily agree with the sum of the individual figures.
*1
Boundary includes Kuraray Co., Ltd. and 66 consolidated subsidiaries (67 consolidated subsidiaries in total, as of the end of December 2025).
*2
Emissions are calculated as “the amount of raw materials, supplies, and services purchased for production (by weight or monetary value) × the emission factor for each substance.” However, where the substance cannot be identified, emissions are calculated using “monetary value × an average emission factor.” Emission factors were sourced from Managed LCA Content ver. 2024 or the Emission Factor Database for Calculating GHG emissions of organizations through the Supply Chain, ver. 3.5.
<Example of Scope 3 GHG Emission Reduction Efforts (Reduction of Environmental Load during Product Transportation)>
We are working to reduce GHG emissions at the logistics stage, when transporting products to users. For example, to improve the efficiency of transportation by truck, we are consolidating the storage locations of products (warehouses) to ship products previously shipped from multiple locations from a single location. Through such large-lot transportation hubs, we are working so that products previously transported using multiple trucks can be loaded onto a single trailer. We also continue to pursue a modal shift, switching from trucks and other motor vehicles to modes of transportation with less environmental impact, such as freight trains and ships. In addition, in 2019 we submitted a declaration of voluntary activities in support of the White Logistics Movement being promoted by the Japanese government.
Carbon Footprint
Carbon Footprint of Products (CFP) Utilization
In response to the growing demand for the calculation of CO2 emissions across the entire supply chain, the Kuraray Gourp has established a globally unified CFP*1 calculation system to reliably provide customers with product carbon footprint data and has been in operarion since 2024. Our CFP calculation methodology makes reference to major international standards*2 and guidelines for the chemical industry*3, and the calculation scope is set as up to the factory gate (cradle-to-gate). Additionally, by assigning the calculations and the verification functions to separate divisions, we have established a framework to enhance the objectivity and reliability of calculation results. Following the revision of the chemical industry’s CFP calculation guidelines for biomass materials in March 2026, we plan to reflect these updates in our internal guidelines in 2026 and establish a system that enables the appropriate evaluation of products developed using biomass materials.
*1
The carbon footprint of products indicates greenhouse gas emissions emitted throughout the entire life-cycle of products or services, from raw material procurement to disposal and recycling, converted into CO2. In the materials industry, it is common to define the calculation range as cradle-to-gate.
*2
ISO14040:2006, ISO14044:2006, ISO14067:2018
*3
Japan Chemical Industry Association/ Guidelines for Calculating the Carbon Footprint of Products in the Chemical Industry (Published February 2023), Together for Sustainability The Product Carbon Footprint Guideline for the Chemical Industry (Version 2.1)
Response to TCFD Recommendations
In November 2020, Kuraray Group endorsed the recommendations of the Task Force on Climate-Related Financial Disclosure (TCFD*) in recognition of the importance of climate change mitigation as a critical issue to be addressed. We disclose the Kuraray Group’s initiatives on climate change in line with the four recommended disclosure contents under the TCFD framework (i.e., Governance, Strategy, Risk Management, Metrics and Targets).
*
TCFD has been established under Financial Stability Board (FSB) to review how to correspond to climate change disclosures and requirements from the financial sector.
Governance
Kuraray Group has established the Sustainability Committee, chaired by the President, to deliberate on, report, and monitor the progress of various initiatives to sustainability issues, including climate change. Under the Sustainability Committee, we have established several project teams to implement the global measures outlined in the Sustainability Medium-Term Plan and to promote the steady execution of each project.
Topics determined as material at Sustainability Committee are proposed to or reported to the Board of Directors, and the opinions from them are reflected in our initiatives to addressing sustainability issues.
Strategy
Kuraray Group has selected the risks and opportunities for events assuming in the transition to a low-carbon society and for physical events caused by climate change as shown in Table 1 below.
Table 1: Risks and Opportunities by Climate Change in Kuraray Group
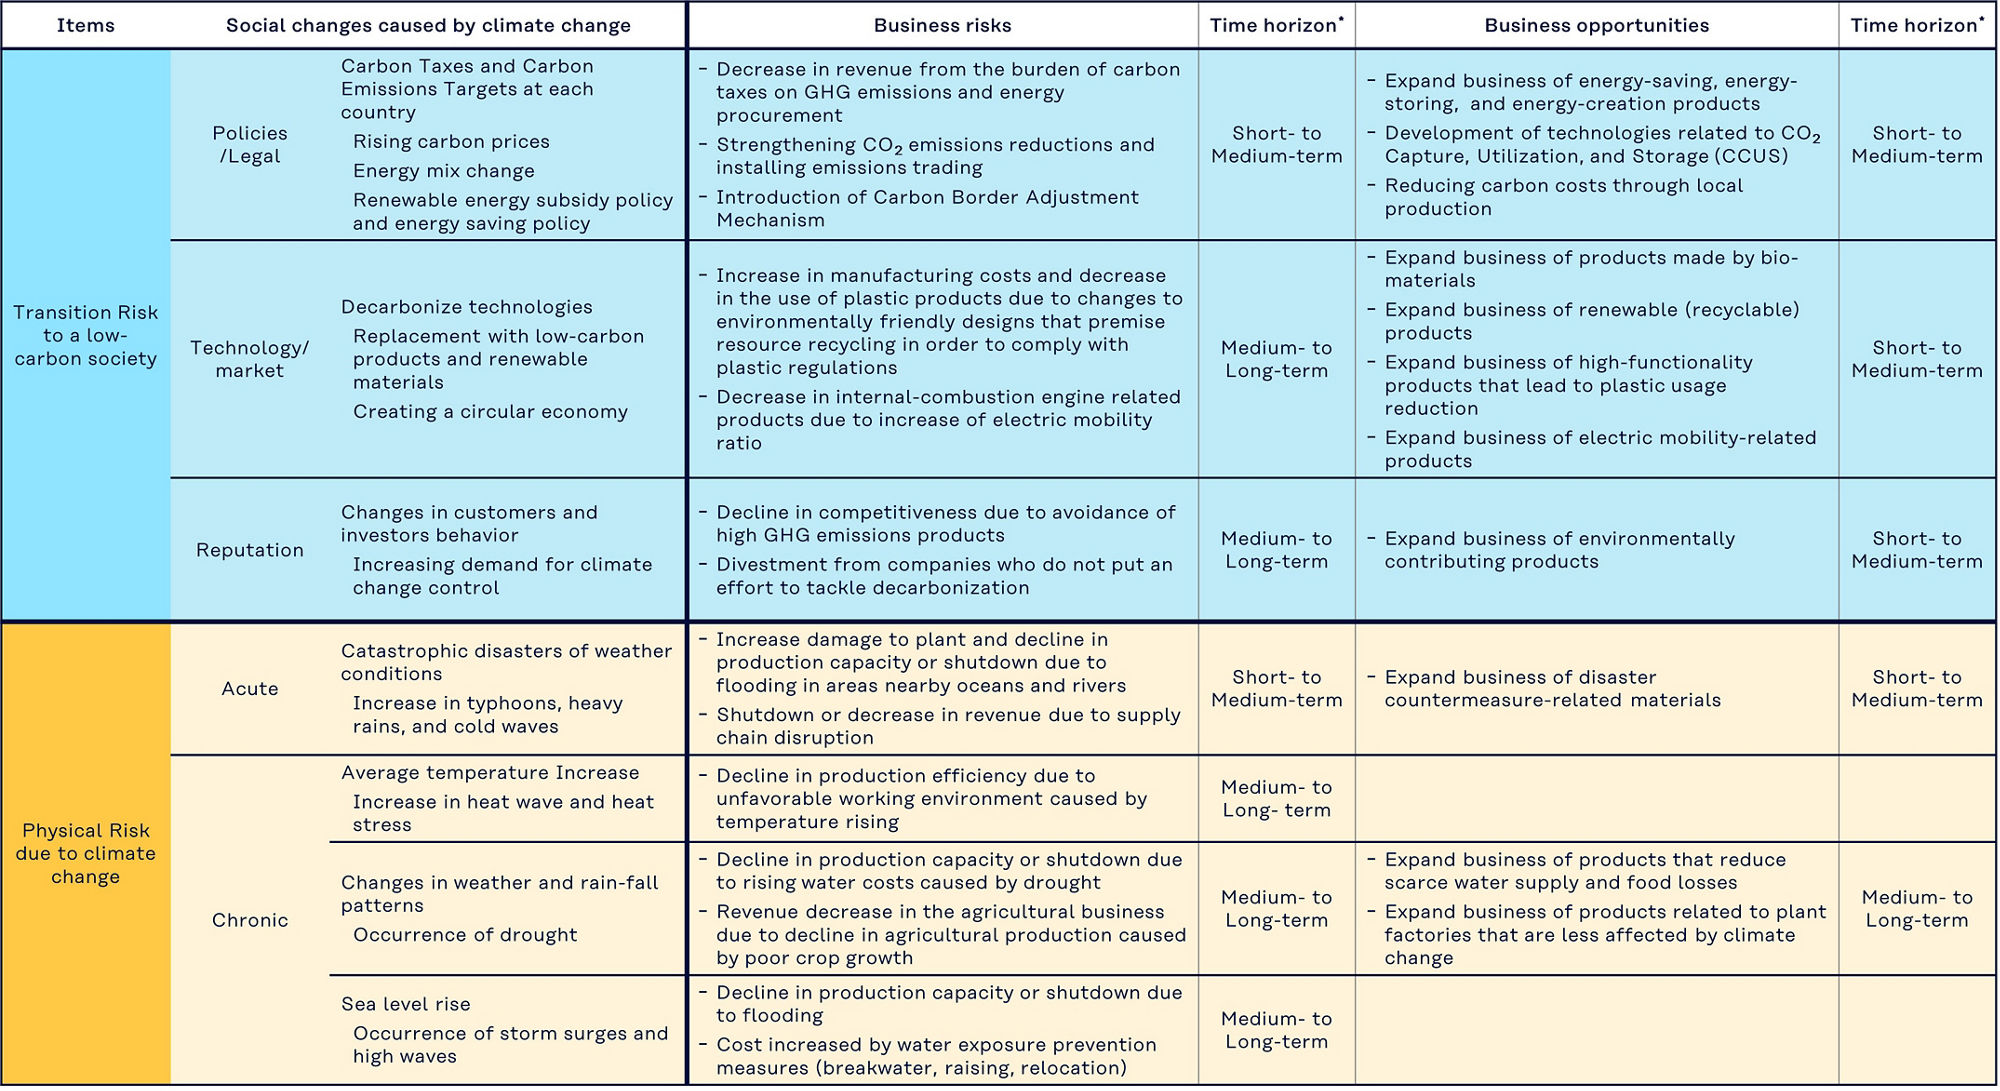
*Time horizon (Short : < 1 year Medium: 1-5 years Long: > 5 years)
Based on the risks and opportunities identified for Kuraray Group in Table 1, we conducted an analysis using the below 2℃ scenario (including the 1.5℃ scenario), in which the shift to a low-carbon society accelerates, as well as the 4℃ scenario, in which climate change continues to progress. The results of this analysis and the potential impacts on the Kuraray Group’s businesses are summarized in Table 2.
【Conditions on scenario analysis】
● Base year: FY2021, Calculation Target Year: FY2035
● Referenced external data:
- World Energy Outlook 2024 (IEA: International Energy Agency)
- Working on a warmer planet (ILO: International Labour Organization)
- Climate Impact (Weathernews Inc.)
Table 2: Business Impact of the Kuraray Group’s Major Risks and Opportunities in Climate Change Scenarios
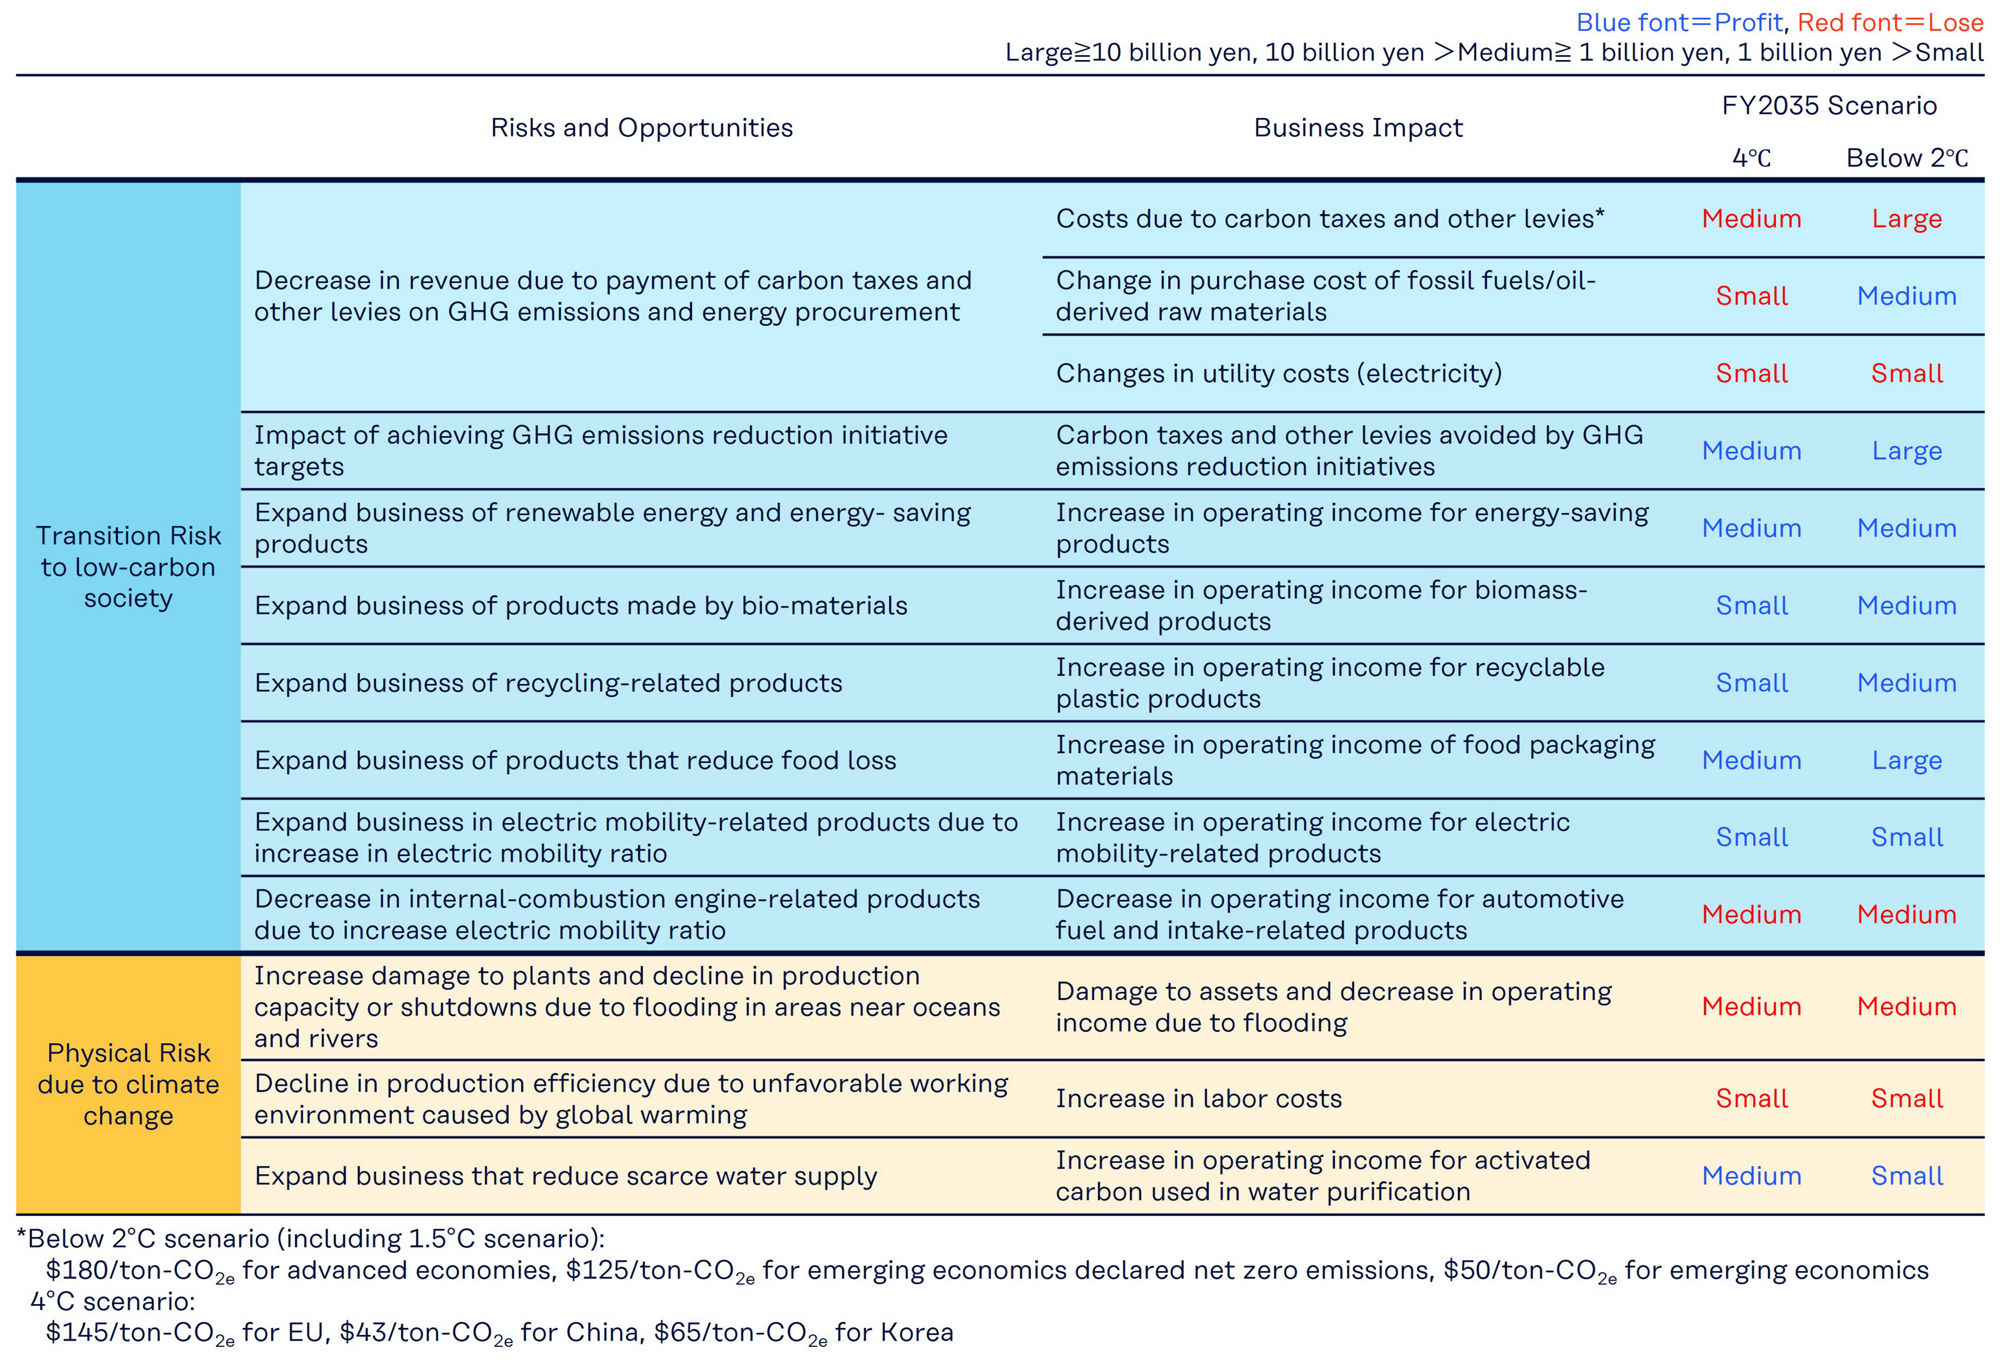
In terms of Transition Risk to a low‑carbon society, our analysis indicates that carbon taxes and other levies on GHG emissions and energy procurement under the below 2℃ scenario could have a significant impact. Even after completing all planned GHG reduction measures by 2035, operating costs could still increase by approximately JPY 26 billion due to these carbon taxes and other levies. Under the current Medium-Term Management Plan “PASSION 2026,” we have introduced an internal carbon pricing system. By taking into account carbon-related taxes and levies on GHG emissions, and we are working to reduce GHG emissions, improve energy efficiency, and expand our businesses with lower GHG emissions. Furthermore, PASSION 2026 highlights Sustainability as an Opportunity as one of three strategic challenges, and we are advancing a range of initiatives. Among these efforts, we have developed the Kuraray PSA system, based on the Portfolio Sustainability Assessment (PSA) methodology established by WBCSD*, which ensures a high level of objectivity and transparency in evaluating product portfolios. Through this system, we aim to expand products that contribute to the natural and living environment and to promote the incorporation of the market value created by these environmentally beneficial products into the pricing of our products and services.
Regarding Physical Risks by climate change, we anticipate potential impacts on our operations due to flooding. In response, we implement safety measures to protect human life and local communities, while striving to maintain business continuity or achieve rapid recovery. In addition, we have implemented measures to compensate for property damages caused by flooding, thereby reducing the impact of such events.
Given that responding to climate change is a Medium- to Long‑Term, we will continue to review existing measures and consider new initiatives at appropriate times.
*
WBCSD: World Business Council for Sustainable Development
Risk Management
Kuraray Group conducts risk management for both Mitigation and Adaptation to the major risks listed in Table 2.
In order to Mitigate Transition Risks to a low-carbon society, we are reducing GHG emissions and expanding sales of products that contribute to the environment. Progress on these initiatives is confirmed by the Sustainability Committee.
For Adaptation measures addressing Physical Risks by climate change, each organization conducts an annual self-assessment of risks from the perspective of disaster preparedness and business continuity. The results of these assessments are discussed by the Risk Management and Compliance Committee (chaired by the director in charge of the Corporate Sustainability Division) which identifies significant risks. These are then designated by the President as management risks, and responsible officers are appointed to oversee the implementation of countermeasures.
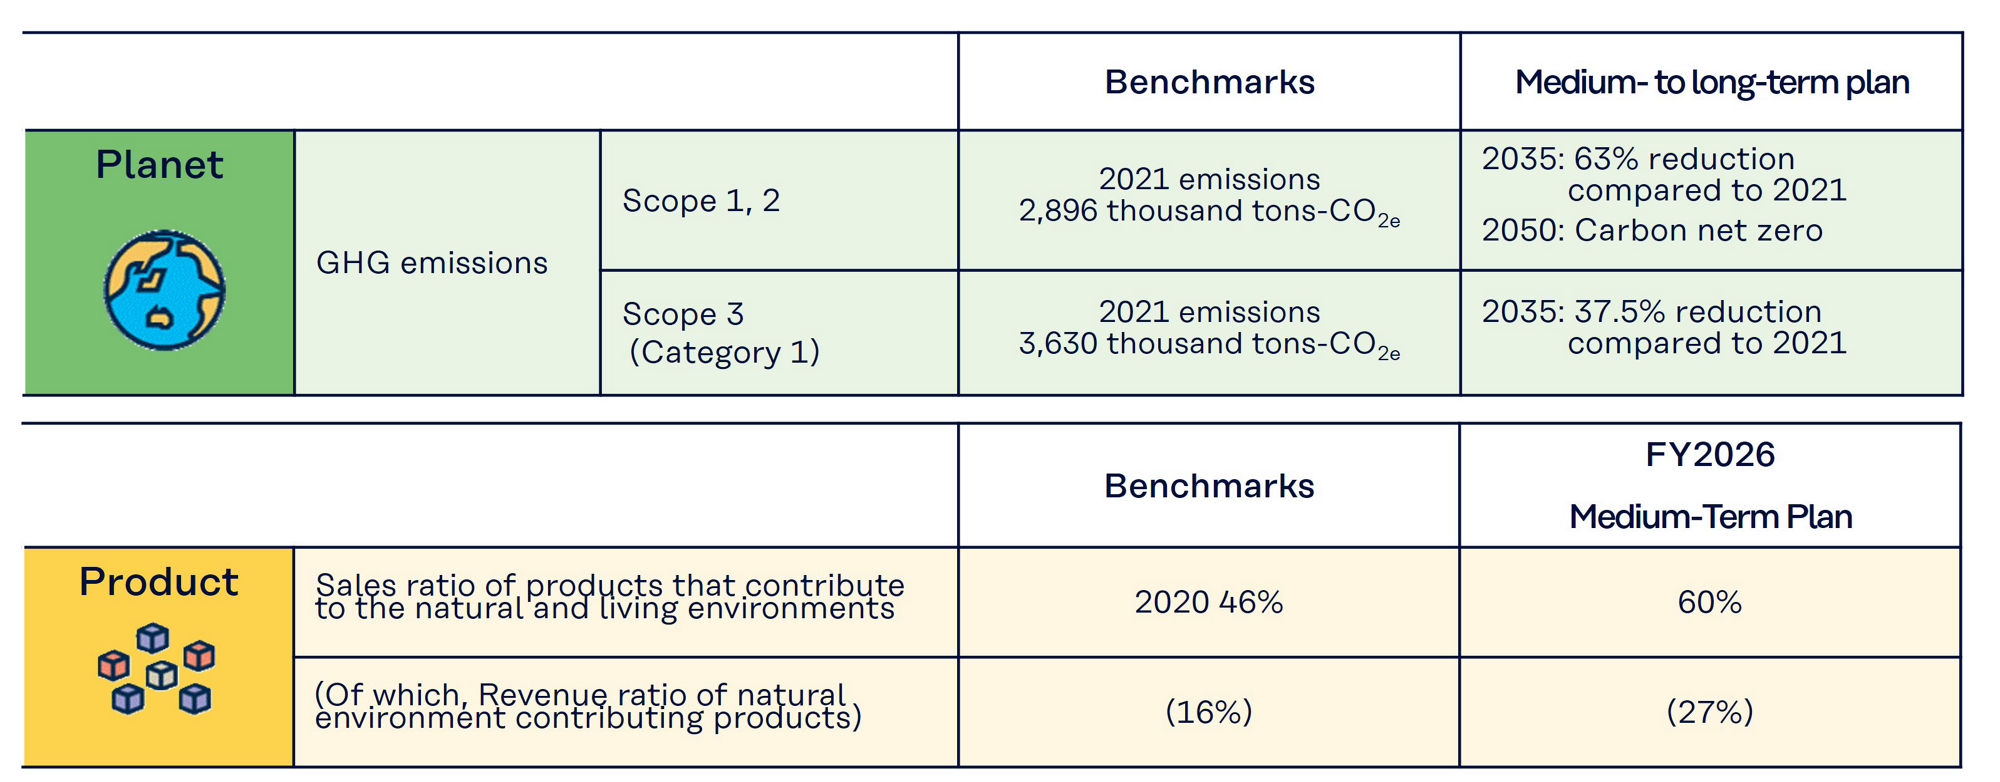
Metrics and Targets
In the Sustainability Medium-Term Plan, Kuraray Group has set targets for reducing GHG emissions related to climate change and increasing sales of products that contribute to the natural and living environment, as shown in Table 3. Kuraray Group has set a goal of achieving net zero carbon emissions by 2050 and has set targets to reduce Scope 1 and 2 emissions by 63% and Scope 3 (Category 1) emissions by 37.5% by 2035 compared to 2021 levels.
Table 3: Measures and Targets Related to Climate Change in the Sustainability Medium-Term Plan
Information aligned with climate-related indicator categories is provided below.
| (1) GHG emissions | > GHG Scope 1 and 2 > GHG Scope 3 |
|---|---|
| (2) Transition risks | > Table 1: Risks and Opportunities by Climate Change in Kuraray Group > Table 2: Business Impact of the Kuraray Group’s Major Risks and Opportunities in Climate Change Scenarios > Kuraray PSA System |
| (3) Physical risks | |
| (4) Climate-related opportunities | |
| (5) Capital deployment | JPY 80 billion capital investment planned by 2030 to reduce GHG emissions |
| (6) Internal Carbon Prices | > Internal Carbon Pricing (ICP) |
| (7) Remuneration | > Officers’ Remuneration System Sustainability-related indicators are reflected in executive compensation |
Internal Carbon Pricing (ICP)
The Kuraray Group uses ICP to incentivize energy saving, identify revenue opportunities and risks, and inform investment decision making, aiming to realize a low-carbon society.
The Kuraray Group's ICP
| Internal carbon price | JPY 10,000/t-CO2e (calculated using internal exchange rates overseas) |
|---|---|
| Starting Date | January, 2022 |
| Scope | Capital investment entailing a change in CO2 emissions |
| Method of application | The costs of changes in CO2 emissions will be calculated using the internal carbon price and used as a criterion for investment decisions |