Updated on May 29, 2026 Environmental Accounting
Basis for environmental accounting calculations
- Reporting period: January 1, 2025 to December 31, 2025
- Scope covered: Kuraray
● Total investments for the current period: 29.1 billion Japanese yen
● Total research and development expenses for the current period: 16.3 billion Japanese yen
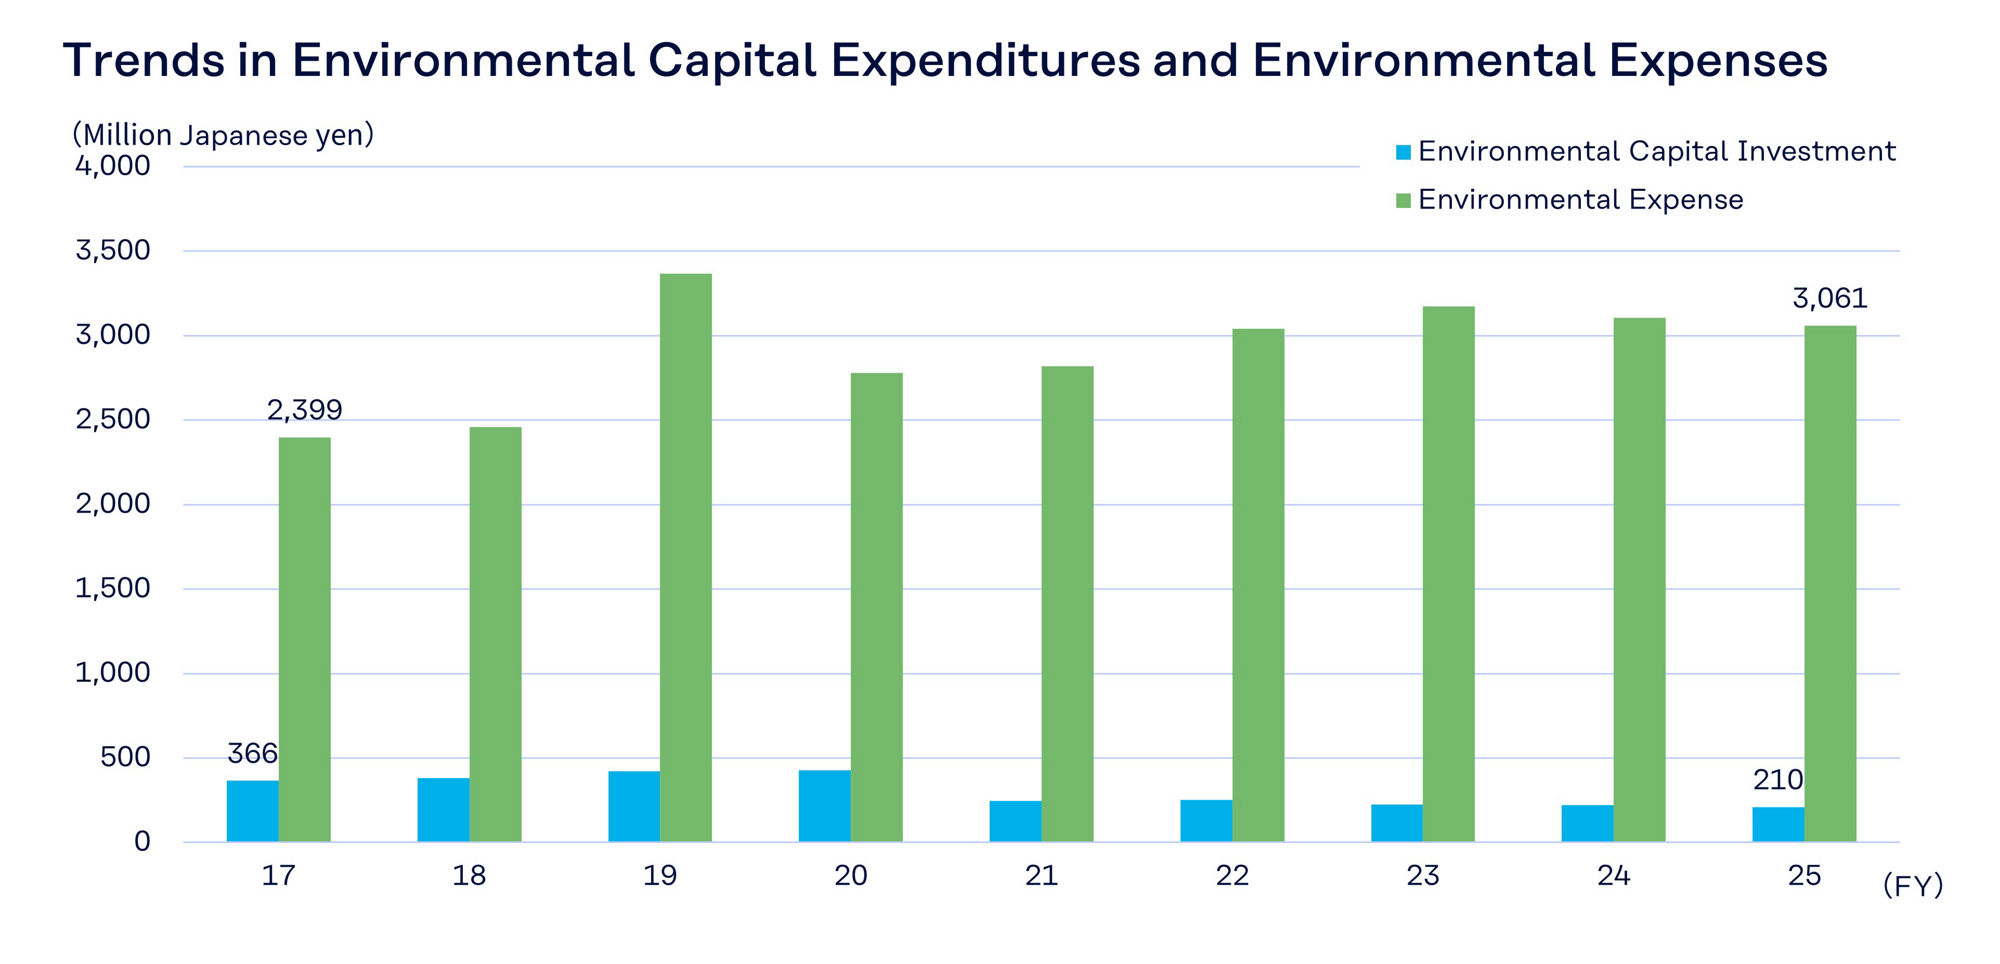
Costs for Environmental Conservation (Million Japanese yen)
| Category | Investments | Cost | Principal activities | |
|---|---|---|---|---|
| Costs within the production sites | Pollution prevention costs | 48 | 2,160 | Operating cost of environmental facilities, measures to prevent emissions of toxic chemical substances |
| Global environmental conservation costs | 8 | 67 | Cost of energy conservation activities | |
| Resource recycling costs | 3 | 474 | Recycling costs and waste processing costs | |
| Total*2 | 60 | 2,701 | ||
| Upstream and downstream costs | 0 | 86 | Recycling and reuse of packaging materials, improvement of container packaging | |
| Administrative costs | 151 | 166 | ISO 14001, environmental measurements, environmental education | |
| Research and development costs | 0 | 108 | Development of environmentally friendly products | |
| Social activity costs | 0 | 0 | Afforestation, beautification, provision of environmental information to host community residents | |
| Environmental damage costs*1 | - | - | ||
| Total*2 | 210 | 3,061 | ||
*1
Environmental damage costs are included in pollution prevention costs.
*2
Due to rounding, totals may not necessarily agree with the sum of the individual figures.
Environmental conservation cost calculation criteria
- Depreciation: Straight-line method
- Standard for allocating costs: In principle, 100% of costs are allocated to individual environmental conservation items. However, a portion of costs is allocated on a pro-rata basis.
Environmental Conservation Effects
| Category | Unit | 2023 | 2024(1) | 2025(2) | Change [(2)-(1)] | |
|---|---|---|---|---|---|---|
| Pollution prevention activities | SOx emissions | Tons | 440 | 510 | 462 | - 48 |
| NOx emissions | Tons | 998 | 1,184 | 879 | - 305 | |
| Soot and dust emissions | Tons | 34 | 95 | 42 | - 53 | |
| Chemical substance emissions*1 | Tons | 671 | 602 | 582 | - 20 | |
| COD load | Tons | 414 | 433 | 799 | 366 | |
| Global environment conservation activities | GHG emissions | thousand tons-CO2e | 1,136 | 1,189 | 1,122 | - 67 |
| Energy consumption | crude oil equivalent, 1,000 kl | 390 | 412 | 398 | - 14 | |
| Resource recycling activities | Externally disposed industrial waste without effective use | Tons | 1,849 | 1,301 | 1,628 | 327 |
| Rate of effective use of waste | % | 95.8 | 97.1 | 96.3 | - 0.8 | |
| Water resource usage*2 | million m³ | 61 | 63 | 58 | - 5 | |
| Total discharge of wastewater*2 | million m³ | 54 | 57 | 49 | - 8 | |
*1
Substances subject to the PRTR Law and substances designated by the Japan Chemical Industry Association
*2
Excluding seawater
Standard for calculating environmental conservation effects
- Effects are calculated in simple comparison with the total environmental load of the previous fiscal year and are not adjusted for production volume.
Standard for calculating economic effects (benefits) of environmental conservation measures.
- Although material effects such as income from recycling are known, benefits are deducted from environmental conservation costs.
For detailed environmental data, please visit the site below.